LinkedIn has evolved from a simple networking platform into the most powerful business development engine available to agency owners and founders in 2025.
But here's the reality most professionals face: despite investing significant time creating content and engaging with their network, they struggle to measure whether these efforts are actually driving business results.
This comprehensive guide will help you navigate LinkedIn analytics, revealing how to transform data into actionable insights that generate qualified leads, establish industry authority, and build valuable client relationships.
Understanding LinkedIn Analytics in 2025
LinkedIn's analytics capabilities have evolved significantly, offering professionals deeper insights into their content performance, audience engagement, and business impact. For agency owners focused on results, understanding these metrics is crucial for optimizing your LinkedIn strategy.
If you want a centralized collection of guides, templates, and playbooks that expand on the ideas in this section, visit the LiGo Hub for curated analytics resources, tips, and step-by-step playbooks.
Where to Find LinkedIn Analytics
LinkedIn provides analytics through several access points:
-
Personal Profile Analytics: Access basic metrics about your personal profile by clicking "View Profile" and then "Analytics" from the dropdown menu
-
Company Page Analytics: Find comprehensive page analytics by navigating to your company page and clicking the "Analytics" tab (read our complete guide to LinkedIn company pages for more)
-
Content Analytics: View performance metrics for individual posts directly beneath each post
-
Campaign Manager: Access detailed advertising metrics through LinkedIn's Campaign Manager platform
These native analytics provide valuable baseline data, though many professionals supplement them with third-party tools for deeper insights.
Essential LinkedIn Analytics Metrics to Track
The most effective LinkedIn analytics strategy focuses on metrics that directly connect to business objectives rather than vanity numbers. Here are the key metrics agency owners should prioritize:
Audience Growth and Quality Metrics
Total Followers: The baseline measurement of your audience size, providing context for engagement rates and reach potential.
Follower Growth Rate: This shows how quickly your audience is expanding, indicating momentum and content resonance.
Follower Demographics: Breakdown of who's following your page by industry, seniority, location, and company size, helping you understand if you're attracting your target audience.
Visitor Demographics: Understanding who visits your profile or page even without following, revealing potential interest from new audience segments.
For strategies to grow your audience intentionally, see our LinkedIn growth roadmap for 2025.
Métricas de participación
Tasa de participación : The percentage of people who interact with your content relative to those who see it, calculated as (reactions + comments + shares) divided by impressions.
Reacciones : The number of emotional responses to your content, indicating initial resonance with your audience.
Comentarios : Often the most valuable form of engagement, comments indicate conversation-starting potential and carry more weight in LinkedIn's algorithm.
Shares: When your content is redistributed to new audiences, extending your organic reach beyond your immediate network.
Post Clicks: The number of times users clicked on your content, including link clicks, image expansions, or "see more" expansions.
For strategies to improve your engagement, check out our guide on LinkedIn engagement and building real connections.
Métricas de rendimiento de contenido
Impressions: The total number of times your content was displayed to LinkedIn users, indicating overall reach.
Click-Through Rate (CTR): The percentage of impressions that result in clicks, showing how effectively your content drives action.
Video Views: For video content, LinkedIn counts a view after just 3 seconds, with additional metrics for 25%, 50%, 75%, and 100% view completion rates.
Document/Carousel Performance: For document posts (carousels), metrics include slide-through rates and average time spent per slide. Learn more in our Guía de tamaño de publicación de carrusel de LinkedIn .
Content Type Performance: Comparative analysis of how different content formats (text, images, videos, documents) perform with your specific audience.
Advanced Analytics for Agency Owners
Beyond basic metrics, these advanced analytics approaches help agency owners extract maximum value from their LinkedIn data:
Competitive Benchmarking
LinkedIn provides several metrics for comparing your performance against competitors:
Follower Metrics Comparison: Compare all-time followers and new followers gained within a specified time range against competitor pages.
Total Post Metrics Comparison: Compare your posting frequency and engagement against competitors over the last 30 days.
Total Engagement Metrics Comparison: Analyze how your engagement levels stack up against similar companies in your industry.
Trending Competitor Posts: Identify standout posts from competitors to inform your content strategy.
This competitive intelligence helps you understand industry standards and identify opportunities to differentiate your approach.
Content Optimization Analysis
By analyzing your highest-performing content, you can identify patterns that inform your ongoing strategy:
-
Topic Performance: Track which subject matters generate the most engagement with your specific audience
-
Format Effectiveness: Determine which content formats (text posts, carousels, videos, etc.) drive the best results
-
Momento óptimo : Identify the days and times when your audience is most receptive to your content (see our research on the mejor momento para publicar en LinkedIn por industria )
-
Messaging Resonance: Analyze which types of hooks, calls-to-action, and value propositions generate the strongest response
This analysis should inform a data-driven content strategy rather than relying on generic best practices.
ROI Measurement
For agency owners, connecting LinkedIn efforts to business results is essential:
-
Attribution Tracking: Use UTM parameters and tracking links to attribute website traffic, leads, and conversions back to specific LinkedIn activities
-
Pipeline Influence: Track how LinkedIn engagement correlates with sales pipeline development and deal progression
-
Client Acquisition Cost: Calculate the total investment (time and tools) divided by the number of clients acquired through the platform
-
Lifetime Value Ratio: Compare the lifetime value of LinkedIn-acquired clients against those from other channels
These metrics help justify LinkedIn investments and optimize resource allocation.
LiGo Analytics: The Complete LinkedIn Analytics Solution
While LinkedIn's native analytics provide basic data, they fall short in several critical areas that matter to agency owners and founders. This is where Análisis de LiGo comes in-offering the most comprehensive LinkedIn analytics solution specifically designed for busy professionals who need actionable insights.
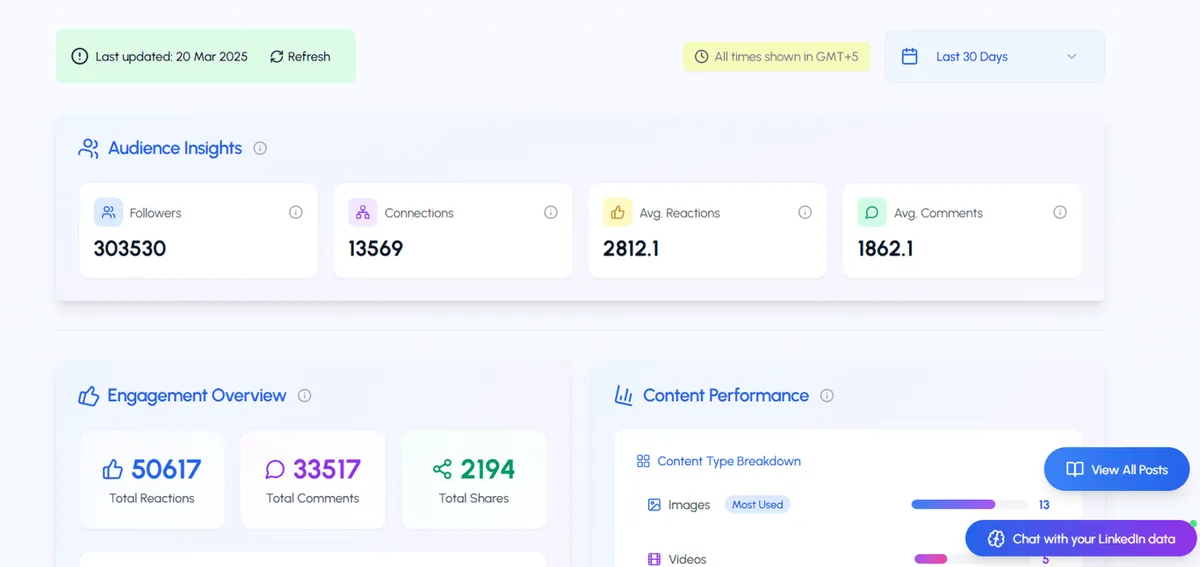
Panel de información de la audiencia
LiGo Analytics begins with a complete audience overview including:
-
Comprehensive follower metrics: Track followers, connections, average reactions, and average comments in a single view
-
Extended historical data: Access analytics across multiple timeframes (7 days, 30 days, 90 days, 180 days, 365 days, and all time), with free plans offering up to 30 days of data and premium plans providing complete historical analysis
-
Desgloses demográficos : Understand your audience composition by industry, seniority, company size, and location
-
Connection quality assessment: Evaluate the quality and relevance of your network, not just its size
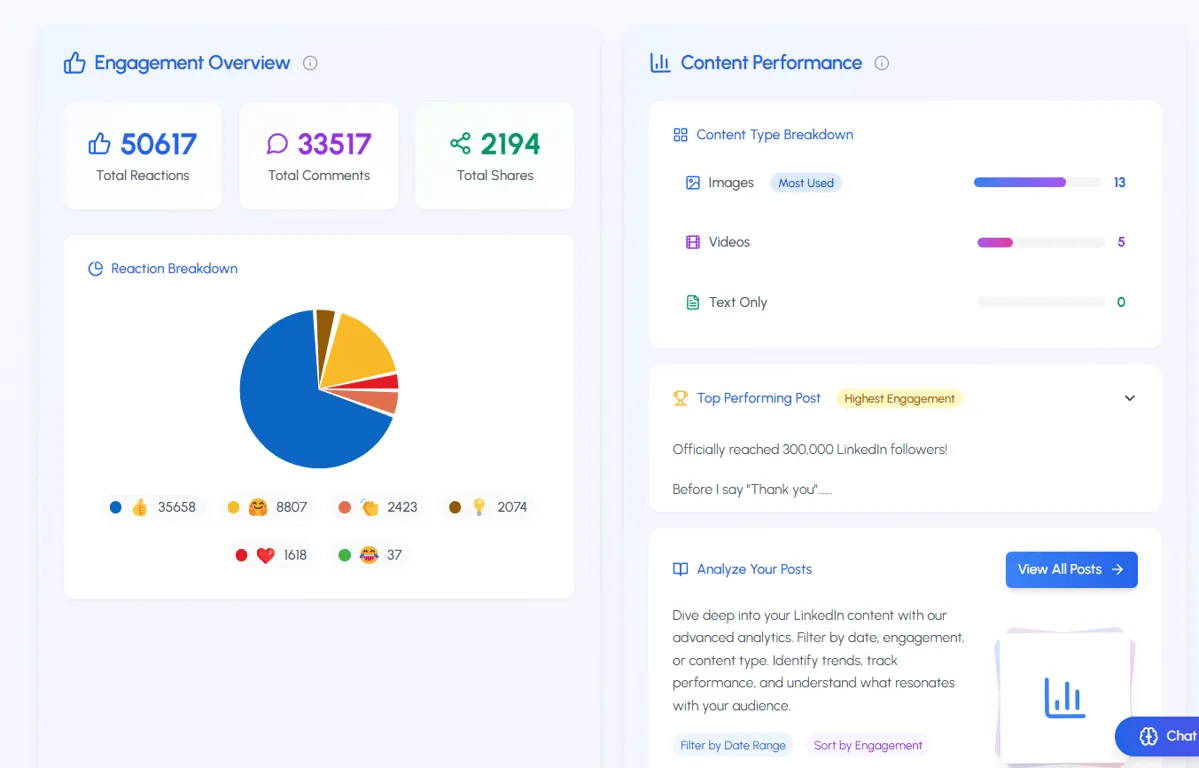
Descripción general del compromiso
LiGo's engagement dashboard goes beyond LinkedIn's native analytics:
-
Métricas de participación integrales : View total reactions, comments, and shares received in a unified dashboard
-
Desglose del tipo de reacción : Analyze which emotional responses your content triggers via intuitive pie charts (likes, celebrations, support, etc.)
-
Rendimiento del tipo de contenido : Compare how different formats perform with your specific audience
-
Identificación de contenido de alto rendimiento : Immediately see your highest-performing posts with the ability to sort all content by engagement metrics
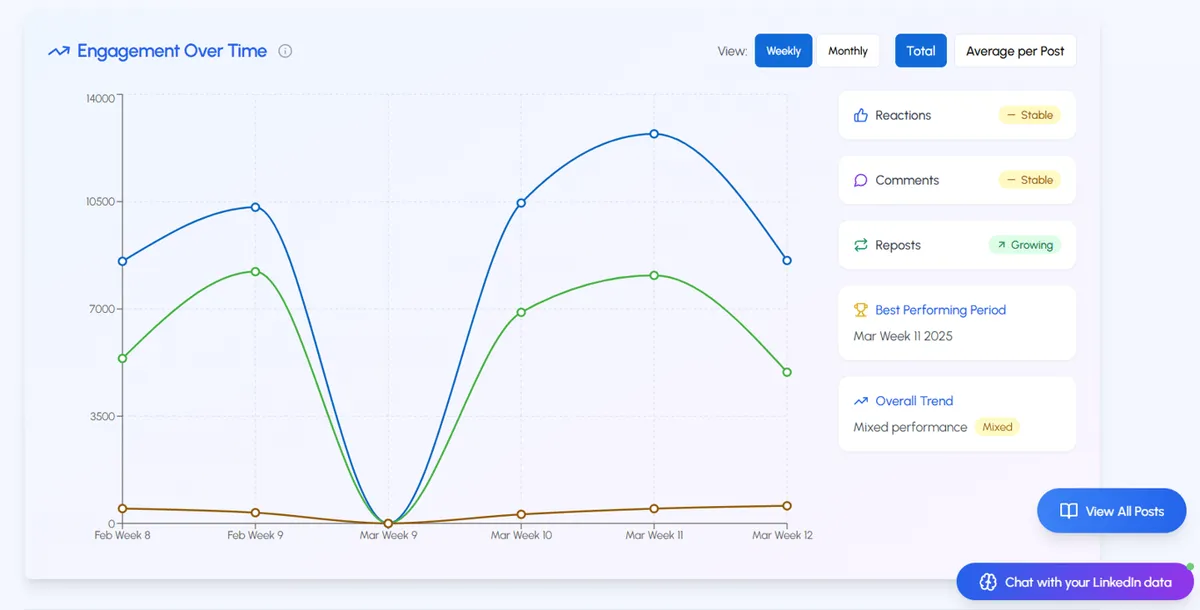
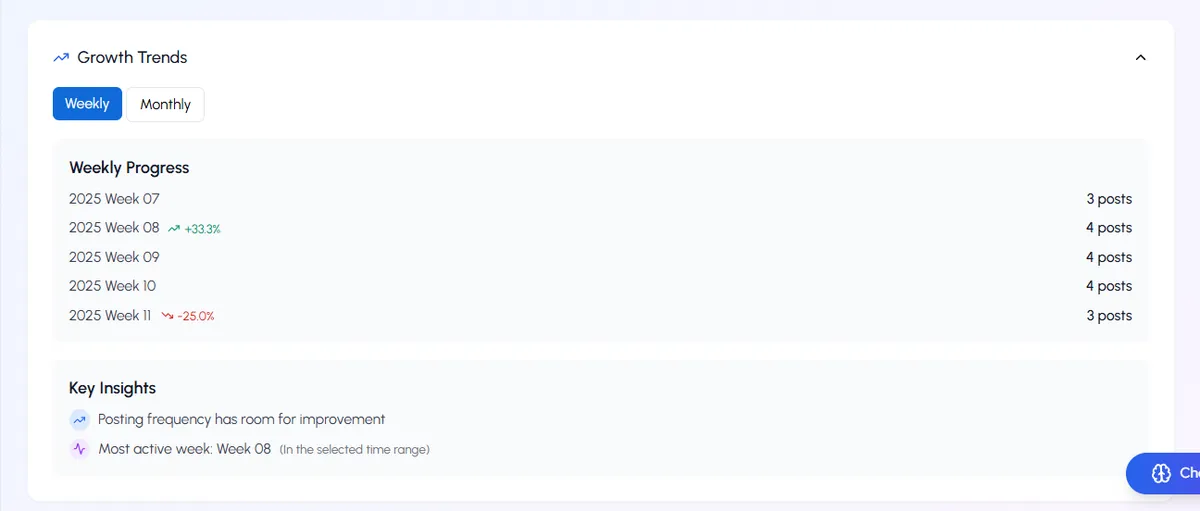
Visualización del rendimiento
LiGo transforms complex data into clear visualizations that reveal patterns:
-
Engagement over time: Interactive graphs plotting reactions, comments, and shares over your selected timeframe
-
Flexible viewing options: Toggle between weekly or monthly views to identify macro and micro trends
-
Cálculo de promedio por publicación : Understand typical performance to identify outlier content
-
Indicadores de crecimiento : Clear visual indicators showing which metrics are growing or declining
Análisis estratégico de tiempos
LiGo's timing analytics provide actionable insights about when to post:
-
Optimización del día de la semana : Data-driven identification of your best-performing days
-
Análisis de la hora del día : Hourly breakdowns showing when your audience is most engaged, divided into 2-hour chunks for precision
-
Desglose día a día : Detailed performance metrics for each day of the week
-
Información de tiempo procesable : Automated key findings delivered as bullet points you can immediately implement
For example, one agency owner discovered their posts made early in the morning (7-9 AM) or late afternoon (4-6 PM) consistently outperformed others by 25%, leading to a simple schedule adjustment that dramatically improved results.
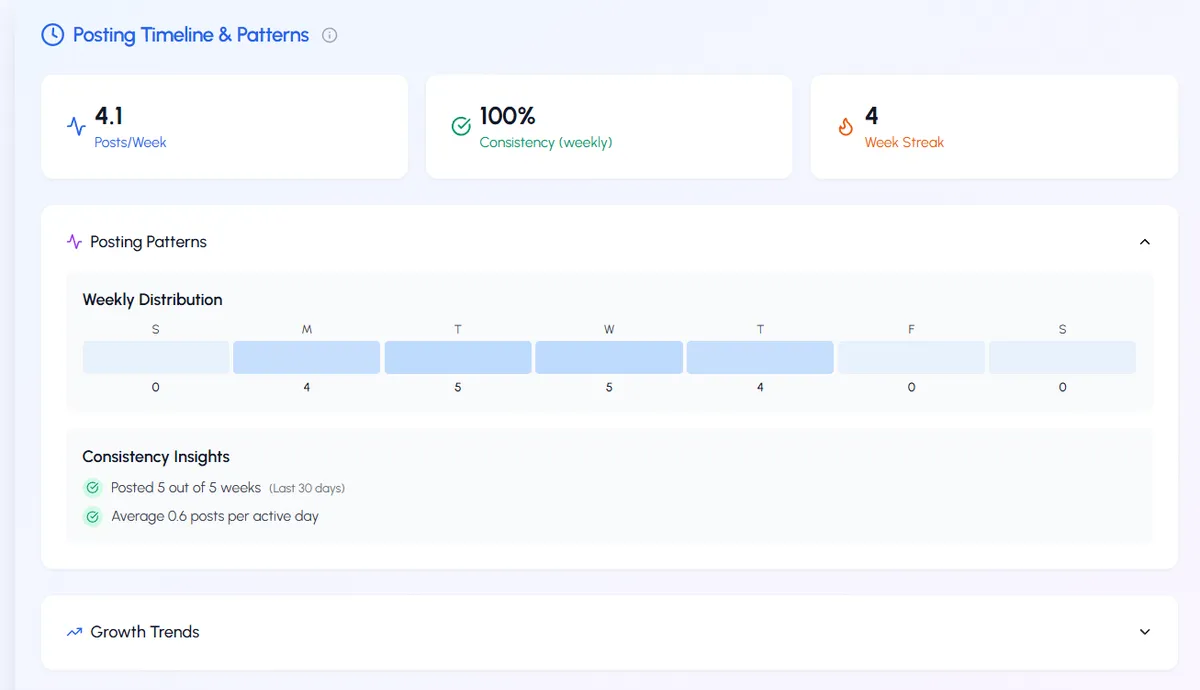
Posting Patterns & Consistency Tracking
LiGo is the only analytics solution that measures the critical factor of consistency:
-
Consistency percentage: Quantification of how consistently you're posting
-
Week streak tracking: Monitoring of consecutive weeks with activity
-
Posts per week metrics: Average and trend analysis of posting frequency
-
Visual posting calendar: Health bar visualization showing activity patterns
-
Month-by-month growth trends: Performance changes correlated with posting activity
This consistency tracking helps agency owners identify how posting frequency impacts performance-a metric completely missing from LinkedIn's native analytics.
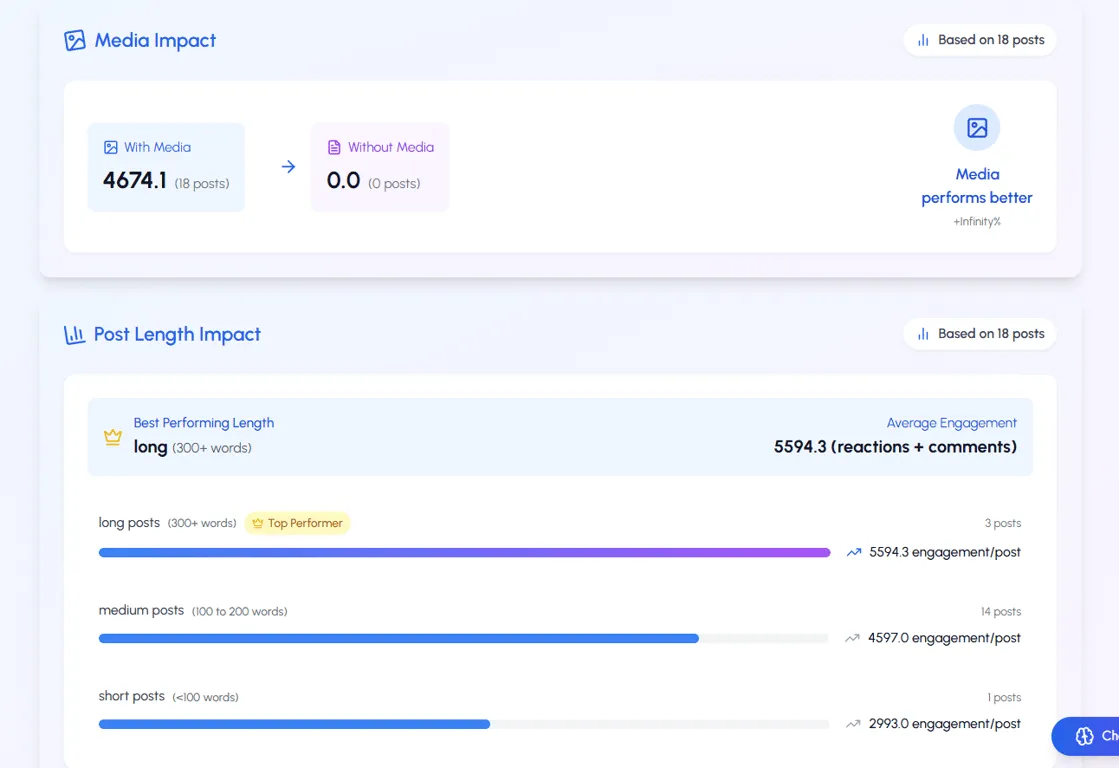
Perspectivas de estrategia de contenido
Make data-driven content decisions with LiGo's unique content analysis:
-
Comparación de medios frente a solo texto : See exactly how much media improves performance for your specific audience
-
Quantified improvement percentages: Clear metrics showing the impact of different content choices
-
Engagement aggregation by type: Total engagement received by each content category
-
Análisis de rendimiento de la longitud de los postes : Comparison of how short, medium, and long posts perform with your audience
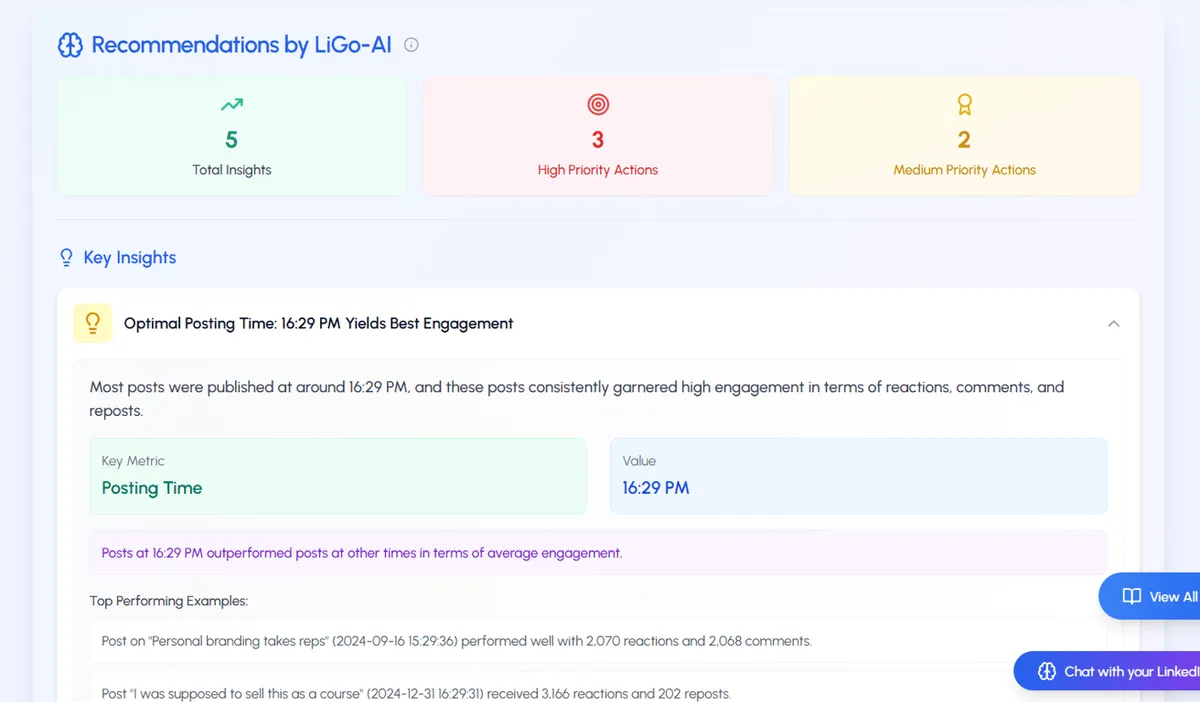
Motor de información impulsado por IA
LiGo's most powerful feature is its AI-powered analytics engine:
-
Generación de información con un solo clic : Simply click "Generate AI Insights" to receive 5 key findings based on your specific data
-
Recomendaciones priorizadas : Actions categorized as high and medium priority for efficient implementation
-
Comprehensive analysis categories: Insights covering posting time, content type, theme performance, engagement patterns, and growth opportunities
-
Evidence-based recommendations: Each insight includes the data behind it and specific examples from your top-performing content
For example, LiGo's AI might identify: "Posts discussing specific client success stories receive 43% higher engagement than general industry commentary. Your post on the Acme Corp case study from March 15th generated the highest engagement this quarter with 217 reactions and 42 comments."
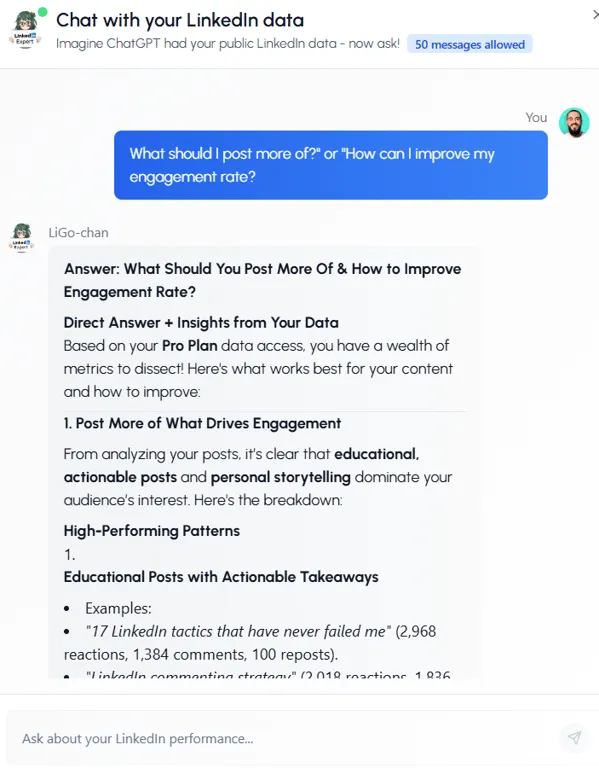
Data Chat: su analista personal de LinkedIn
LiGo's newest analytics feature is truly revolutionary-a conversational AI interface that lets you chat directly with your LinkedIn data:
-
Consultas en lenguaje natural : Ask questions like "What were my best-performing posts last month?" or "Which topics drive the most comments?"
-
Generación de análisis personalizados : Request specific insights such as "Compare my video performance to carousel posts" or "Analyze my growth trend over the past quarter"
-
Recomendaciones de estrategia : Ask for advice like "What should I post more of?" or "How can I improve my engagement rate?"
-
Asistencia en la creación de contenido : Generate new posts based on your historically successful content with requests like "Create a post similar to my top-performing post from last month"
This feature essentially gives you a dedicated LinkedIn analyst available 24/7 to answer any question about your performance and strategy.
How to Use LinkedIn Analytics to Improve Your Strategy
For agency owners and founders, the true value of analytics lies in how you apply these insights to enhance your LinkedIn strategy:
1. Set Clear KPIs Aligned with Business Goals
Before diving into metrics, establish specific, measurable objectives for your LinkedIn presence:
-
Brand awareness and authority building
-
Lead generation and prospect nurturing
-
Talent acquisition and employer branding
-
Partnership development and networking
-
Customer retention and relationship management
Each objective requires tracking different metrics and implementing different optimization strategies. For help defining your LinkedIn strategy, see our guide on cómo crear una estrategia de LinkedIn que 10 veces tus clientes potenciales entrantes .
2. Implement a Regular Analytics Review Process
Establish a consistent schedule for analyzing your LinkedIn performance:
-
Weekly Quick Reviews: Check basic engagement metrics and respond to trends
-
Monthly Deep Dives: Analyze content performance patterns and audience growth
-
Quarterly Strategic Assessments: Evaluate business impact and adjust overall approach
This structured approach ensures you're consistently learning from your data rather than collecting metrics without action.
3. Segment Your Analytics by Content Categories
Rather than analyzing all content together, segment your analytics by:
-
Content themes or topics
-
Content formats (text, image, video, document)
-
Content objectives (educational, promotional, engagement)
-
Target audience segments
This segmentation reveals which content types work best for specific goals and audiences.
4. Test and Measure Systematically
Implemente un enfoque de prueba estructurado para mejorar continuamente el rendimiento:
-
Forme una hipótesis clara (por ejemplo, "Las publicaciones con visualizaciones de datos generarán una mayor participación que las publicaciones de solo texto")
-
Crear contenido de prueba que aísle la variable que está probando
-
Mida los resultados con respecto a su contenido de control
-
Implementar enfoques exitosos de manera más amplia
-
Documente los aprendizajes para referencia futura
This scientific approach yields more reliable insights than random experimentation.
For more on how to use analytics to improve your strategy, read our guide on cómo utilizar la analítica para mejorar tu estrategia de contenidos en LinkedIn .
If you want ready-to-use KPI templates, weekly review checklists, and campaign blueprints you can copy into your analytics process, grab them from the LiGo Hub to speed up your analytics review cycles
Errores comunes de LinkedIn Analytics que se deben evitar
Even experienced professionals make these common mistakes when implementing LinkedIn analytics:
1. Centrarse en las métricas de vanidad
El error : Priorizar el número de seguidores y los "me gusta" sobre los resultados comerciales significativos.
La solución : Focus on metrics that directly connect to your business objectives, such as lead generation, website traffic, or client acquisition. See our article on métricas de vanidad vs. autenticidad en LinkedIn for more.
2. Analizar sin contexto
El error : Mirar las métricas de forma aislada sin considerar los puntos de referencia de la industria o el rendimiento histórico.
La solución : Compare sus métricas con los promedios de la industria, el rendimiento de la competencia y sus propios datos históricos para obtener un contexto significativo.
3. Failing to Connect Analytics to Action
El error : Recopilar datos sin implementar cambios basados en información.
La solución : Para cada revisión de análisis, identifique acciones específicas para optimizar su estrategia en función de lo que revelan los datos.
4. Ignorar los insights de la audiencia
El error : Centrarse únicamente en el rendimiento del contenido sin comprender la demografía y el comportamiento de la audiencia.
La solución : Revisa regularmente los datos de la audiencia para asegurarte de que estás llegando a tu mercado objetivo y ajusta tu estrategia de contenido en consecuencia.
The Implementation Gap: Why Most LinkedIn Analytics Efforts Fail
At this point, you understand the importance of LinkedIn analytics and the metrics that matter. But there's a critical factor that derails most analytics efforts: the implementation gap.
Agency owners and founders juggle countless responsibilities-client work, team management, business development, and more. Finding time to consistently track metrics, analyze patterns, and implement data-driven improvements often feels impossible.
This implementation gap is the primary reason most LinkedIn analytics efforts fall short-not because the insights aren't valuable, but because they're impossible to maintain consistently while juggling other priorities.
How LiGo Bridges the Analytics Implementation Gap
Para los propietarios y fundadores de agencias que hacen malabarismos con múltiples responsabilidades, LiGo is specifically designed to bridge this implementation gap:
Automated Data Collection
LiGo automatically gathers and organizes all relevant LinkedIn metrics, eliminating the need for manual data collection or spreadsheet maintenance.
One-Click Analysis
Generate comprehensive reports and insights with a single click rather than spending hours combing through multiple data sources.
AI-Powered Interpretation
LiGo's AI analytics engine automatically identifies patterns, trends, and opportunities that might take hours to discover manually.
Action-Oriented Insights
Receive specific, prioritized recommendations you can implement immediately, transforming data into practical strategy improvements.
Seamless Integration with Content Creation
Unlike standalone analytics tools, LiGo integrates analytics directly with content creation, allowing you to immediately apply insights to your upcoming posts.
Conclusion: From Data to Strategic Decisions
For agency owners and founders, LinkedIn analytics should never be about collecting numbers for their own sake. The true value lies in translating these insights into strategic decisions that enhance your professional presence and drive business growth.
El enfoque más efectivo combina:
-
Objetivos comerciales claros vinculados a métricas específicas
-
Análisis periódico de los datos de rendimiento
-
Ajustes estratégicos basados en insights
-
Pruebas y optimización continuas
By implementing the analytics framework outlined in this guide-and leveraging tools like LiGo to bridge the implementation gap-you can transform your LinkedIn presence from a time-consuming obligation into a data-driven business development engine.
Remember that LinkedIn analytics is an ongoing process, not a one-time assessment. The professionals who achieve the greatest success are those who consistently measure, learn, and adapt their approach based on real performance data rather than assumptions or generic best practices.